
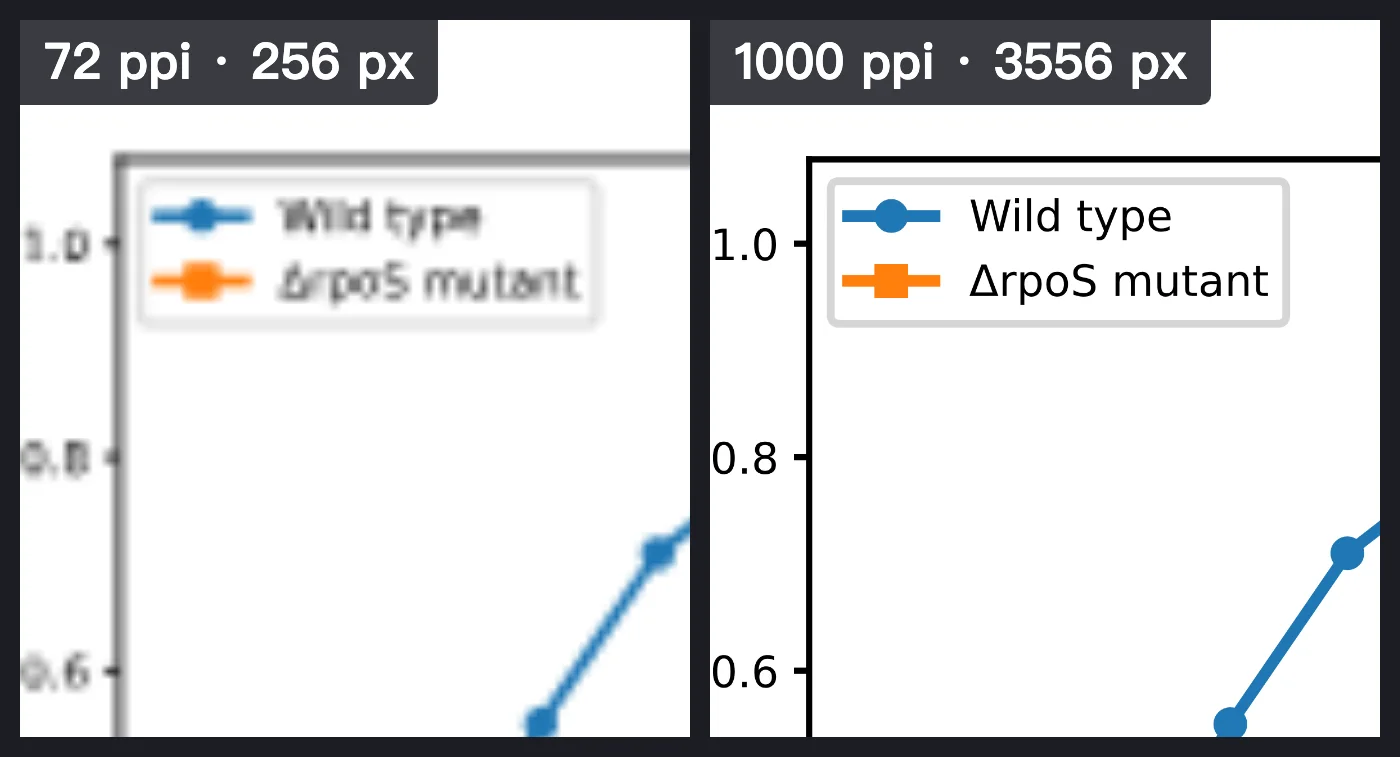
The submission system says your figure’s resolution is too low. What it measures is pixels against the printed width, so the fix is to export more pixels from the original plot, not to change a number in the file.
| Figure type | Elsevier asks | 90 mm column | 190 mm, two columns |
|---|---|---|---|
| Photographs, micrographs (halftone) | 300 dpi | 1063 px | 2245 px |
| Photos with labels or arrows (combination) | 500 dpi | 1772 px | 3741 px |
| Plots, diagrams, line drawings (line art) | 1000 dpi | 3544 px | 7481 px |
| Vector figure (PDF, EPS) | no dpi | keep it vector | keep it vector |
Lettering at the printed size: 7 pt, sub- and superscripts 6 pt. Tiers, widths and type sizes from Elsevier's artwork instructions, read 2026-10-20; other journals set their own values, commonly 300–1200 dpi, so check your author guide. Pixel counts are rounded up.
Why changing the dpi field does nothing
dpi is pixels divided by printed inches. A 1063-pixel-wide image printed 90 mm wide is 300 dpi; the same image printed 190 mm wide is 142 dpi. The number stored in a PNG or TIFF header is only a label for that division. Typing 300 into it changes no pixel, and the submission system measures pixels against the width you give.
A figure drawn as vectors, such as a plot saved as PDF or SVG from Matplotlib, R or Origin, has no dpi until it becomes pixels. That is the moment to choose the number: export at 300, 500 or 1000 ppi and the pixel count follows. If all you have is a small PNG, an AI upscaler can enlarge it, but the pixels it adds are guesses, and tick labels and data points can come out changed. Journals also limit generative AI in figures: according to Elsevier’s author guidelines, a plot must be faithfully derived from the underlying data, and AI tools must not create or alter primary research images such as micrographs. Go back to the plotting program and save PDF or SVG.
Export the figure at the resolution the journal asks
-
Click Open the figure file and pick the PDF, SVG, EPS or .ai file your plotting program saved.
-
Look at the labels. A PDF saved by Matplotlib with its default settings brings each label in as shapes in the font it was plotted in: it looks right but can’t be retyped. A PDF that keeps its labels as type opens them as type, and a font your computer doesn’t have, such as DejaVu Sans, is listed in the Resolve Missing Fonts dialog; replace it with a font you have, such as Arial, before you go on, or the labels are shown in a substitute font and their widths change.
-
Scale the figure to the printed width. Choose Select > All (Ctrl+A / Command+A), open Window > Transform, turn on Constrain Width and Height Proportions and type W 90 mm (or 190 mm). Then choose Object > Artboards > Fit to Artwork Bounds. Typing the width into the artboard alone only crops the figure.
-
Check the lettering. A figure plotted 6.4 in wide with 10 pt labels has about 5.5 pt labels at 90 mm, under the 7 pt minimum. Labels that are type can be set to 7 pt in the Character panel; labels that came in as shapes can’t, so go back to the plotting program, set the figure size to the column width (3.54 in for 90 mm) and save the PDF again.
-
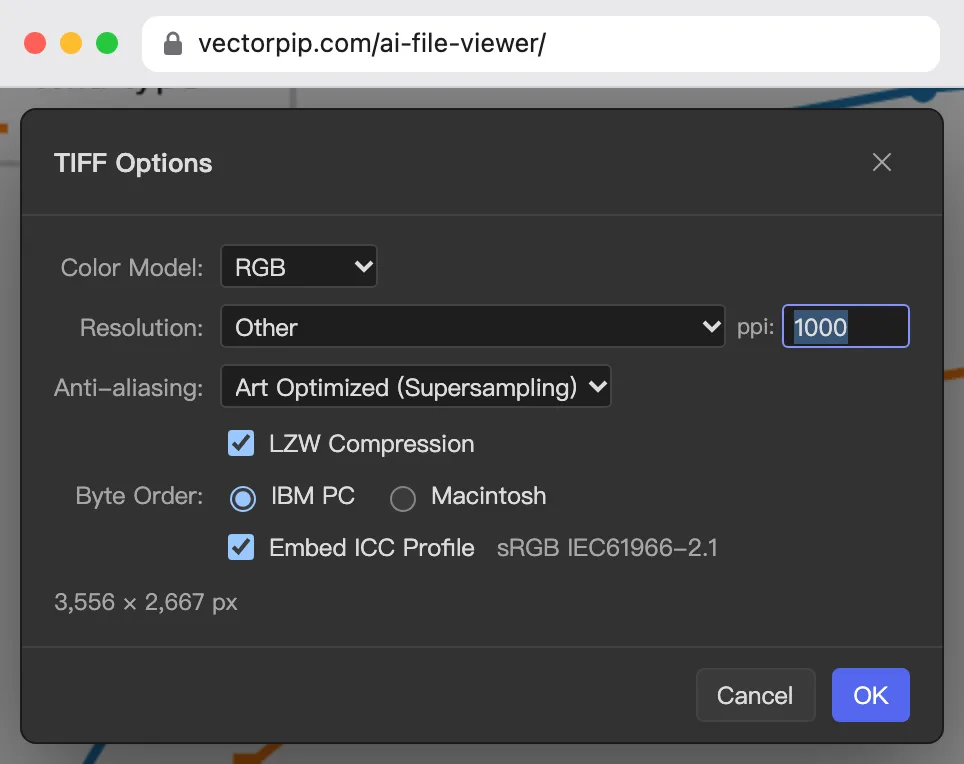
Choose File > Export > Export As…, format TIFF (tif). Under Resolution choose Other and type 1000 for line art, or choose High (300 ppi) for a photograph. Turn on LZW Compression and Embed ICC Profile. The line under the options shows the pixel count before you click OK: 3,556 × 2,667 px for this figure, above the 3,544 px a 90 mm column needs.
-
For a journal that takes vector files, choose File > Save As… > PDF with the [High Quality Print] preset instead. Every letter is drawn as its shape in the PDF, so the labels print as you see them.
Note: an export larger than 16384 px a side is refused. 190 mm at 2400 ppi is past it; 1000 ppi (7481 px) is fine. The figure is opened and exported in your browser; it is not uploaded.
Sources and dates
- 1000 dpi line art, 300 dpi halftone, 500 dpi combination; 90 / 140 / 190 mm column widths; 7 pt lettering: Elsevier artwork and media instructions, artwork sizing page, read 2026-10-20.
- Generative AI in figures: Elsevier’s generative AI policies for journals, the section on figures, images and artwork (policy updated June 2026), read 2026-10-21.
- Pixel counts: width in mm ÷ 25.4 × dpi, rounded up to the next whole pixel.
- The figure on this page is a Matplotlib 3.11 PDF saved with default settings (6.4 × 4.8 in, 10 pt DejaVu Sans), opened, scaled and exported in Vectorpip on 2026-10-21.
Next steps
- Your plot is an SVG: edit the SVG, then save PDF or export TIFF.